
Is There a Relationship Between Employee Happiness and Job Turnover?
Dataset Description
How to cite:
Bebenroth, R. and Berengueres, J.O., 2020. New hires' job satisfaction time trajectory. International Journal of Human Resources Development and Management, 20(1), pp.61-74.
Can Happiness Predict Employee Turnover, or is it the Other Way Around?
It is the summer of 2016. I am in Barcelona and it is hot and humid. By chance I go to a talk where Alex Rios - the ceo of myhappyforce.com explains his product. He has built an app where employees report daily happiness levels at work. This app is used by companies to track happiness of the workforce. After the talk I ask him if he would opensource the (anonymized data) so we can better understad the phenomenon of employee turnover. Here is what we did, we developed a model that predicts which employees will churn. Then we looked at the features (used by the model) that are common to employees that churn. The top feautures of employees that churn are:
- low ratio of likes received (likeability)
- low posting frequency (engagement),
- low relative happiness (employee happiness normalized by company mean).
Surprisingly, a priori expected explanatory features such as mean happiness level and the ratio of likes (positivity), were not significant. Precision@50 = 80% out of a test set with 116 churns, sample size N=2k. Another surprise was that raw happiness is a bad predictor of churn. But, the question is, What did we miss? Can you find more insights?
Starter script
R starter script https://www.kaggle.com/harriken/how-many-unlikes-it-takes-to-get-fired
Content
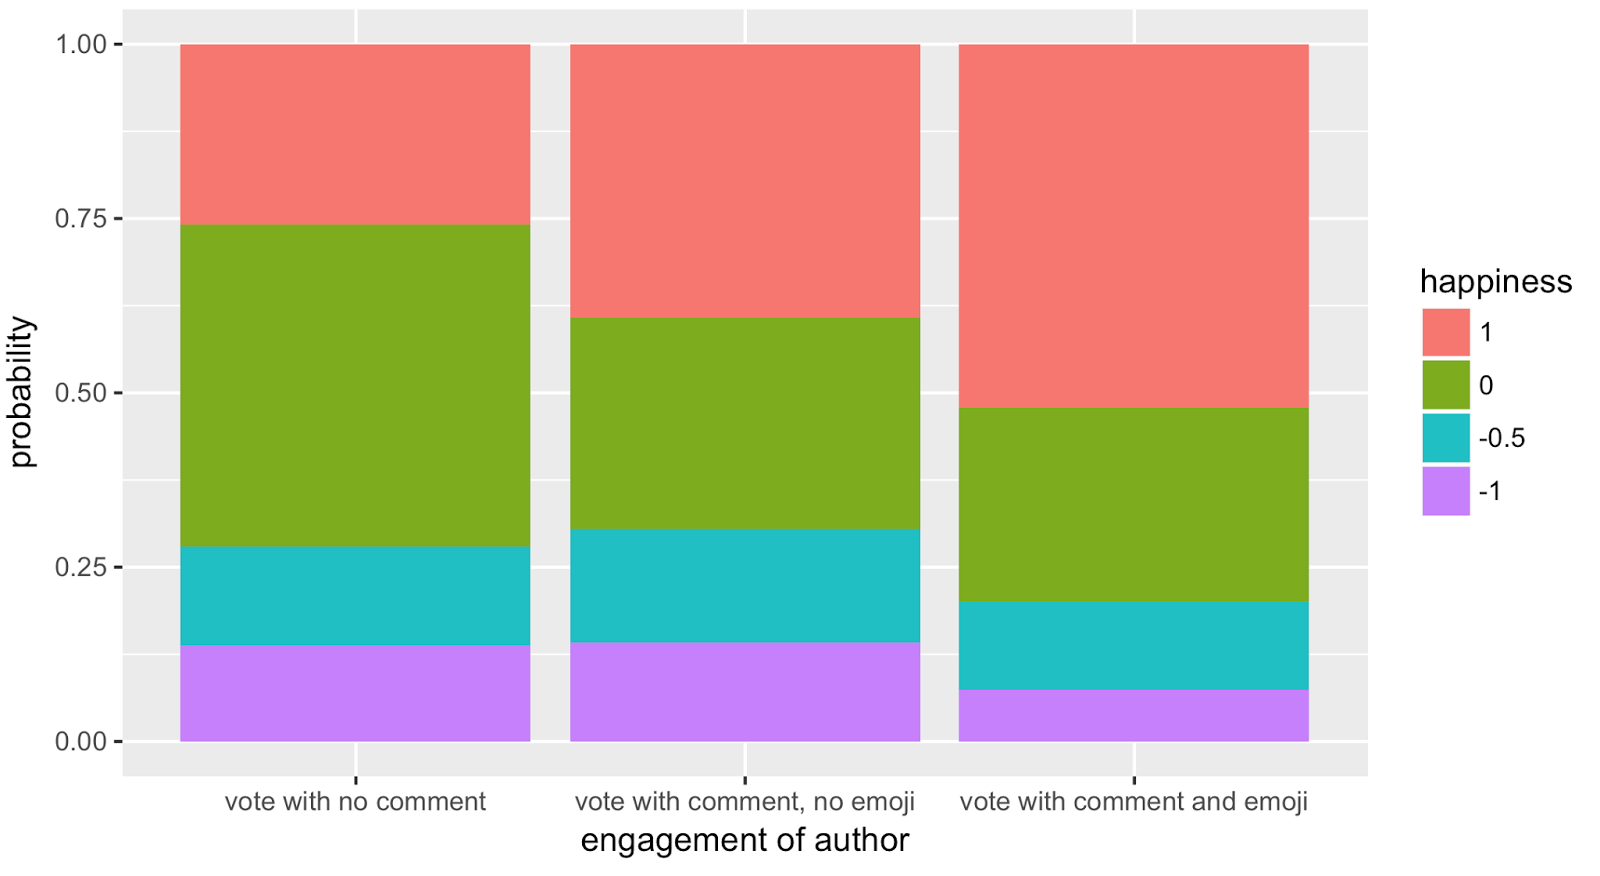
The data consists of four tables: votes, comments, interactions and churn. A vote was obtained when an employee opened the app and answered the question: How happy are you at work today? To vote the employee indicates their feeling by touching one of four icons that appeared on the screen. After the employee indicates their happiness level, a second screen appears where they can input a text explanation (usually a complaint, suggestion or comment), this is the comments table. Out of 4,356 employees, 2,638 employees commented at least once. Finally, in a third screen the employee can see their peers’ comments and like or dislike them, this data is stored in the interactions table. 3,516 employees liked or disliked at least one of their peers’ comments. The churn table contains when an employee churned (quit or was fired).
Acknowledgements
- Python script version with social graph features: http://bit.ly/2v2sEZg
- More detailed R scripts: https://github.com/orioli/e3
- The paper which was presented at ASONAM 2017 Sydney
- Slides https://www.slideshare.net/harriken/ieee-happiness-an-inside-job-asoman-2017
Inspiration
The cost of employee turnover has been pointed out extensively in the literature. A high turnover rate not only increases human resource costs, which can reach up to 150% of the annual salary per replaced employee, but it also has social costs, as it is correlated with lower wages, lower productivity per employee, and not surprisingly, a less loyal workforce 1. For reference, in 2006, turnover at Walmart’s Sam’s Club was 44% with an average hourly pay of $10.11, while at Costco it was a much lower 17% with a higher $17.0 hourly wage 2. In addition, a more recent study correlated companies with low turnover with a series of socially positive characteristics dubbed high-involvement work practices 3. On the other hand, research on employee turnover (churn) is not a prolific topic in the engineering community. In IEEE publications, one can find just over 278 publications with titles containing the keyword churn, and the bulk of those focus on customer churn, and specifically churn in the telecommunications industry, while on the topic of employee churn there is just one title indexed 4. The goal is to clarify the characteristics of employees that will churn (or that are at risk of churning), to help companies understand the causes so they can reduce the turnover rate.

